What is an NGDP target?
You probably know that GDP stands for Gross Domestic Product. This is the conventional way of measuring economic activity, and reveals the market value of final goods. When we’re interested in whether people are getting richer or poorer, we look at real GDP, which strips out the effects of inflation. This allows us to make meaningful comparisons about the productive performance of an economy across different time periods, and the chart below shows what’s happened to GDP in the UK from 1997-2019:
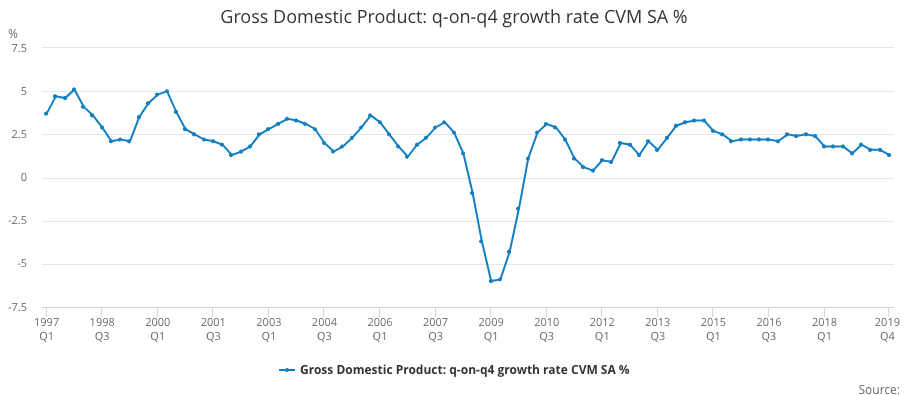
Source: ONS (Gross Domestic Product: q-on-q4 growth rate CVM SA % (IHYR))
The real growth rate for the UK from 1949-2019 averaged 2.5%, but more recently it seems to be below this. While this may be a concern, in normal times it is driven by factors outside the control of central banks (such as the productivity of labour and capital).
Central banks do, however, have a large influence over the nominal growth rate, which is the cash value of economic activity (i.e. without stripping out the effects of inflation). The chart below shows annual NGDP growth from 1997-2022.
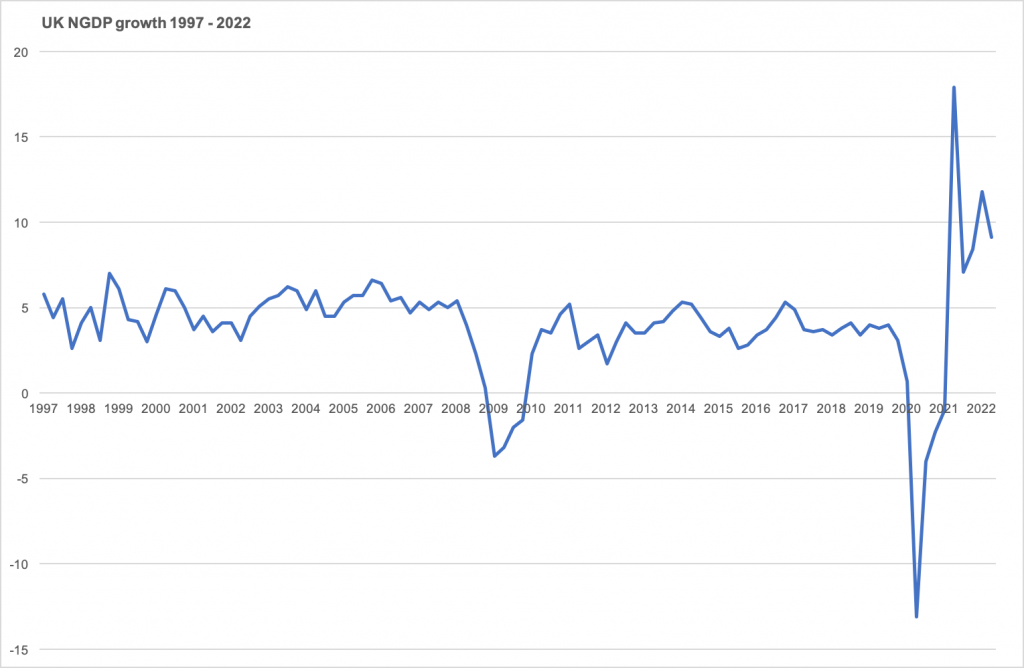
Source: ONS (Gross Domestic Product: q-on-q4 growth quarter growth: CP SA % (IHYO))
Notice a few interesting things:
- Prior to the global financial crisis (i.e. from 1997-2008) it was fairly stable at around 5%.
- It significantly contracted during the global financial crisis.
- From 2011-2019 it was slightly more volatile and a slightly lower rate (averaging below 4%).
- It was extremely volatile during the covid pandemic and recent energy shocks.
Now, here are the big claims I wish to make:
(i) The reason that economic performance was reasonably good from 1997-2008 was because NGDP growth was stable.
(ii) The subsequent and more recent poor performance was due to having left that 5% growth path.